
Scaling the Application: Not an Answer to Every Performance Issue

This is part of The True Code of Production Systems. The series is about the decisions that only become visible when something breaks in production.
The traffic spike arrived at 11:47 on a Tuesday morning.
It was not unexpected. The marketing team had sent a campaign email to two hundred thousand users, and the engineering team had prepared for it. Auto-scaling was configured. Thresholds had been reviewed. The load balancer was healthy. The week before the campaign, the team had done a walkthrough of the system and satisfied themselves that nothing obvious would break.
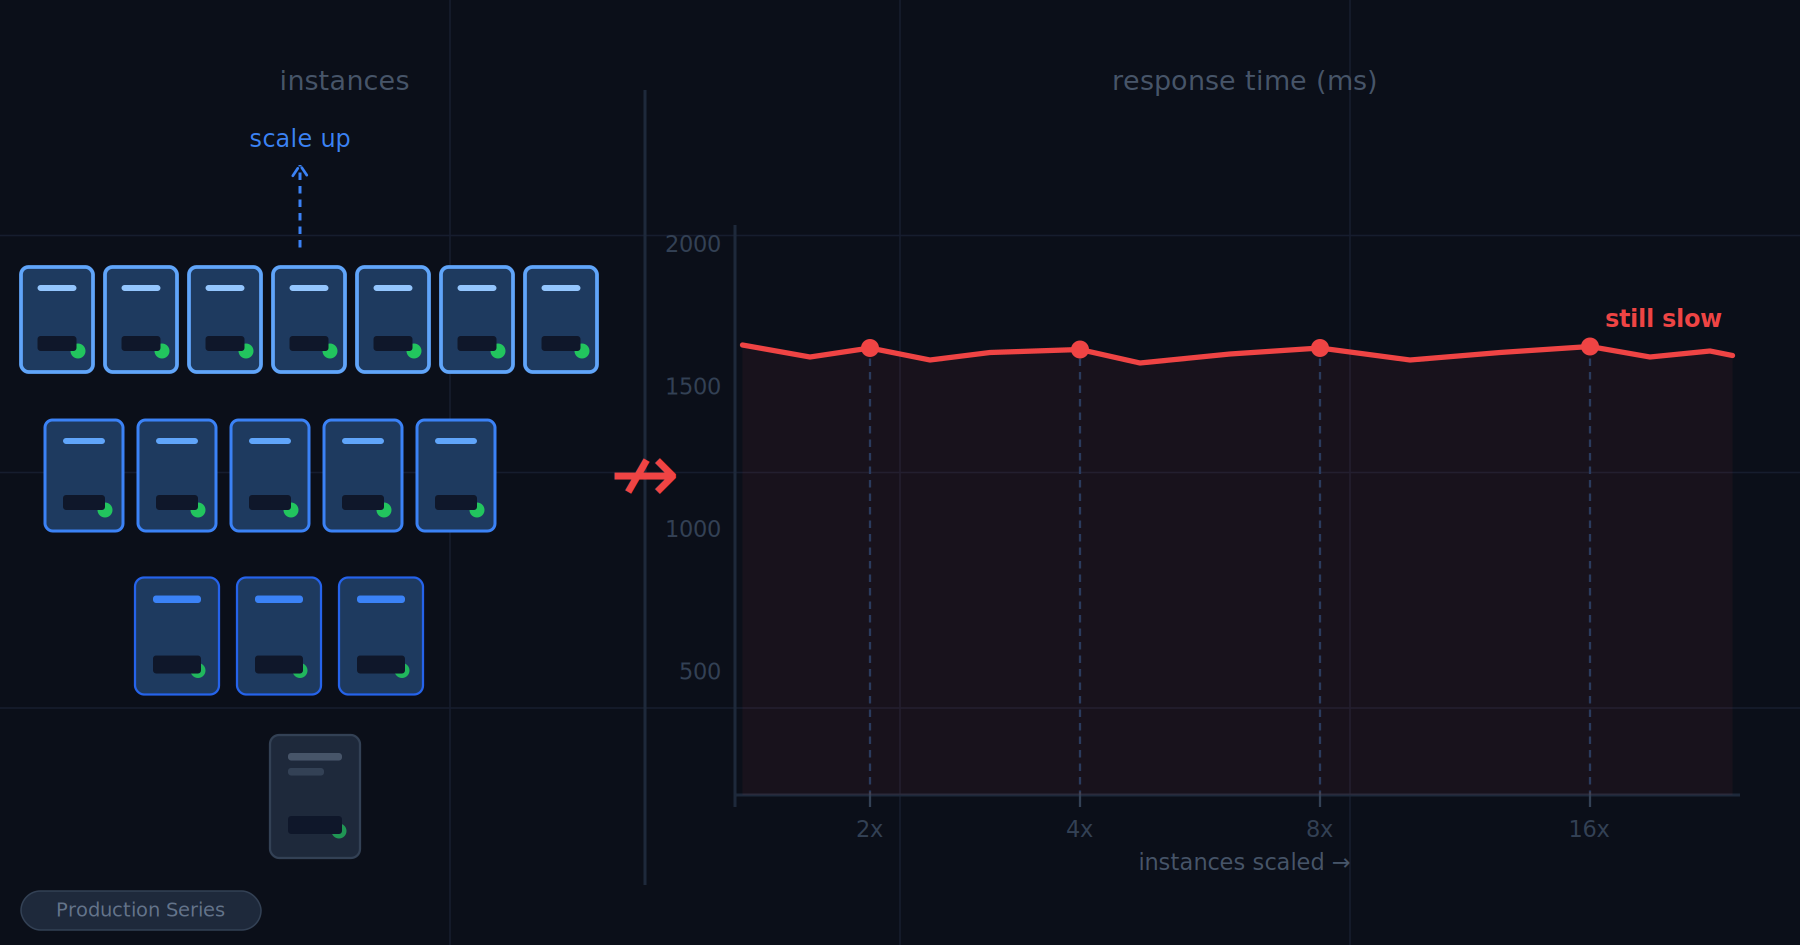
When the spike hit, Azure App Service did exactly what it was configured to do. The scale-out rules triggered. Four instances became eight. Eight became fourteen. Each scaling event appeared in the Azure portal in real time, a reassuring sequence of confirmations that the system was responding correctly to load.
Response times got worse with every instance that came online.
By the time the group had scaled to fourteen instances, the average API response time had gone from 180 milliseconds to just over four seconds. The error rate was climbing. Users were experiencing timeouts. Engineers were in a call, watching metrics move in the wrong direction, with more compute running than the system had ever had.
The application was not the bottleneck. It had never been the bottleneck. The application was stateless, well-written, and perfectly capable of handling the load. Every new instance that came online connected to the same Azure SQL database, opened its own connection pool, and immediately began competing with every other instance for the same constrained resource. Fourteen instances meant fourteen connection pools hammering a single database tier that had not been provisioned for anything close to that volume of concurrent connections. The database query times climbed. The application instances waited. Users waited behind them.
More compute. More pressure on the real problem. Worse performance at every step.
What Scaling Actually Does
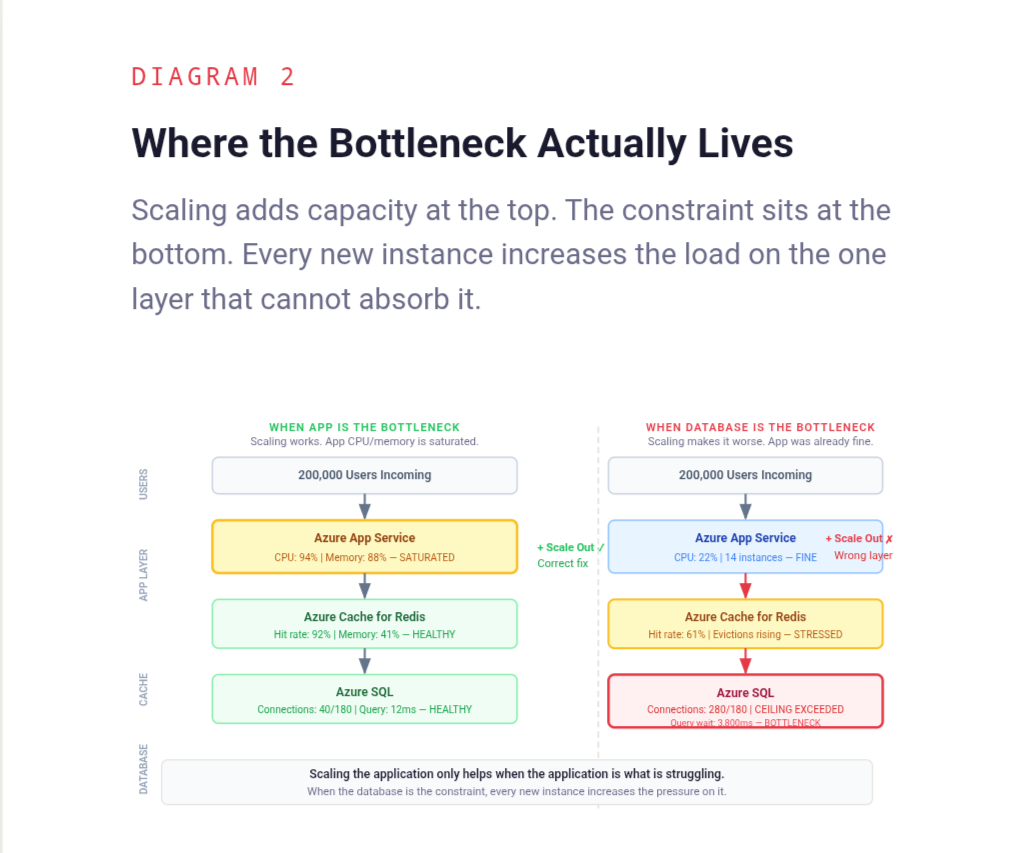
When engineers talk about scaling an application, they almost always mean horizontal scaling - adding more instances of the stateless application layer. More App Service instances, more container replicas in AKS, more virtual machines behind a load balancer running the same code. This is a legitimate and often correct response to certain kinds of load. But it solves a specific problem: insufficient compute capacity in the application layer. It does not solve any other problem, and in systems with a stateful bottleneck somewhere downstream, it actively makes things worse by multiplying the pressure on the layer that was already struggling.
Every additional instance added to a horizontally scaled application layer is another consumer of every shared resource behind it. The Azure SQL database. The Azure Cache for Redis cluster. The Service Bus. The third-party API with a rate limit that does not care how many App Service instances are calling it. Adding instances upstream of a saturated stateful layer does not relieve that layer. It increases the demand on it while the application waits longer for responses, which drives response times up, which triggers more scaling events, which adds more instances, which increases demand further.
This is not a failure of auto-scaling configuration. It is a consequence of scaling the wrong layer. The auto-scaler did exactly what it was told. The problem is that what it was told to do was not connected to where the actual constraint lived.
Ask yourself: when the system slows down under load, is the application layer actually the component that is struggling? Or is it waiting on something behind it?
The Bottleneck Is Usually Not Where the Symptoms Appear
Performance problems in distributed systems have a consistent and frustrating property: they surface in one place and originate in another. The application layer is where requests arrive and where timeouts are reported. It is the most visible layer, the most instrumented layer, and the layer that engineers interact with most directly. It is also, very often, not where the performance problem lives.
A slow application instance is usually a waiting application instance. It is waiting for a database query to return. It is waiting for a cache that is under memory pressure and evicting keys faster than they can be rebuilt. It is waiting for a downstream service that is itself struggling. It is waiting for a connection pool slot to become available because every other thread in every other instance is also waiting. The symptom is a slow application. The cause is a saturated dependency.
Scaling the application adds more threads that can wait simultaneously. It does not shorten the wait.
Finding the real bottleneck requires looking at the layer the application is waiting on, not at the application itself. For most systems under load, that means starting with Azure SQL - specifically connection pool saturation, query times under concurrent load, and lock contention on heavily written tables. It means looking at Azure Cache for Redis hit rates, because a cache that is evicting data under load is silently pushing more traffic to the database behind it. It means checking whether any single downstream dependency is absorbing a disproportionate share of response time across all requests. Application Insights makes this visible through the dependency tracking view, but only if someone is looking at it rather than the instance health panel. These are not always where engineers look first, because they are not where the error messages appear. The production systems that fail the hardest are the ones where symptoms and causes live furthest apart.
Ask yourself: for the last performance incident in this system, where did the slowdown actually originate? Was it in the application layer, or was the application layer waiting on something else?
The Database Connection Pool Is a Fixed Ceiling
This is the mechanism behind most of the incidents that look like application scaling failures but are actually database saturation events.
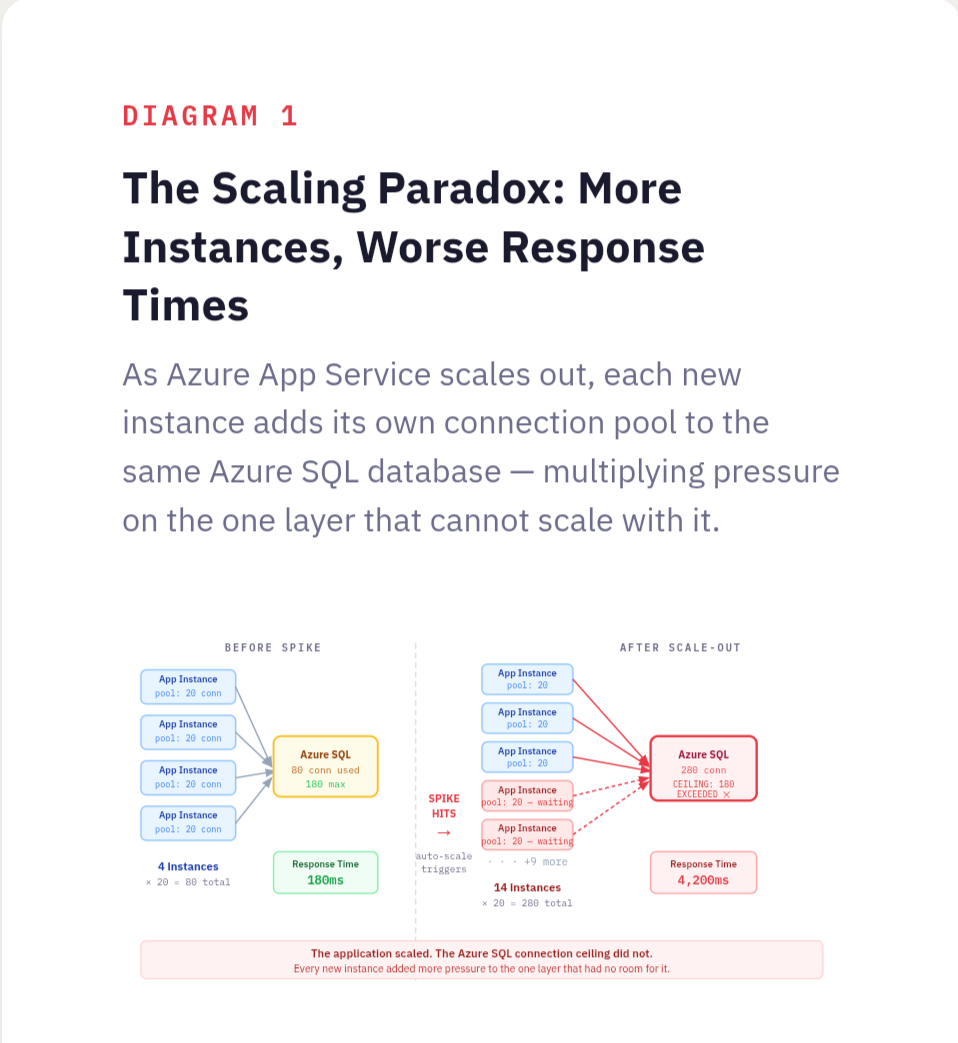
Azure SQL has a maximum number of concurrent connections it can accept, and that ceiling varies by service tier. A General Purpose database on a two-vCore configuration allows around 180 concurrent connections. A Business Critical tier on four vCores allows more, but the ceiling still exists, and it does not move when more application instances connect to it. When the ceiling is reached, new connection requests queue or fail, and every application thread waiting for a connection sits idle, holding a request that a user is on the other end of.
Each App Service instance maintains its own connection pool. The pool size is typically configured once, at deployment time, and rarely revisited. When a single instance is running with a pool of twenty connections, the database is handling twenty concurrent connections from that source. When fourteen instances are running with the same pool configuration, the database is handling two hundred and eighty concurrent connections from the application layer alone, before accounting for any other services connecting to the same database.
The math is straightforward. The consequences are not always anticipated.
Scaling the application without understanding the connection arithmetic is how teams end up in situations where adding capacity makes things worse. The fix is not always to scale the database tier. Connection pooling at the infrastructure level, using Azure SQL's built-in connection limits awareness or a proxy layer, allows many application instances to share a smaller pool of actual database connections. Query optimisation that reduces the time each connection is held can increase effective throughput without touching the connection limit. Azure SQL read replicas can distribute read traffic without increasing write connection pressure. These are targeted interventions that address the actual constraint. Horizontal application scaling is not.
Ask yourself: what is the maximum number of concurrent database connections your system will open at peak scale? Has that number ever been compared against what the database can actually handle?
External Rate Limits Do Not Scale With Infrastructure
The Azure SQL connection ceiling is at least a constraint within the team's control. External rate limits are a harder version of the same problem.
Third-party APIs - payment processors, identity providers, logistics platforms, communication services - impose rate limits that are defined in a contract and enforced at the provider's edge. Those limits are typically expressed as requests per second or requests per minute per API key. They do not change because the calling system scaled out. Fourteen App Service instances calling a payment API that allows one hundred requests per minute collectively produce one hundred requests per minute of capacity, the same as one instance would. What changes is the speed at which that limit is reached. Fourteen instances competing for the same rate-limited resource will exhaust the quota faster, receive throttling responses sooner, and produce a pattern of failures that looks, from the application side, like a performance problem that scaling made worse.
This surfaces in a specific and confusing way during load spikes. The system scales out to handle increased traffic. Each additional instance begins making calls to the external dependency. The rate limit is hit faster than it was before scaling. Throttling responses arrive. The application retries, which consumes more of the quota. Error rates climb while the team is watching the Azure portal showing healthy-looking App Service instances running at low CPU. The infrastructure looks fine. The system is not fine.
Observability that stops at the application boundary misses this entirely. Application Insights dependency telemetry can surface throttling response codes from external APIs, but only if those responses are being tracked and alerted on. The only way to catch this problem is to measure what happens at the integration point - response codes from external APIs, retry rates, throttling events - and treat those metrics with the same attention given to application-level metrics.
Ask yourself: which external dependencies in this system have rate limits? At peak scale, how close does the system get to those limits? Is that being measured?
When the Cache Stops Helping
Caching is one of the most effective tools for reducing load on stateful systems, and one of the most dangerous when it degrades silently under pressure. Azure Cache for Redis, under memory pressure, begins evicting keys. Evicted keys produce cache misses. Cache misses produce direct Azure SQL queries. Under a traffic spike, this cascade can happen faster than any Azure Monitor alert is configured to fire.
The irony is that scaling the application accelerates this process. More App Service instances mean more cache read operations per second, which means faster memory turnover, which means higher eviction rates under the same Redis cache size. The cache that was handling the load comfortably at four instances starts struggling at fourteen, not because anything changed in the Redis configuration, but because the demand on it multiplied while the memory allocated to it stayed the same.
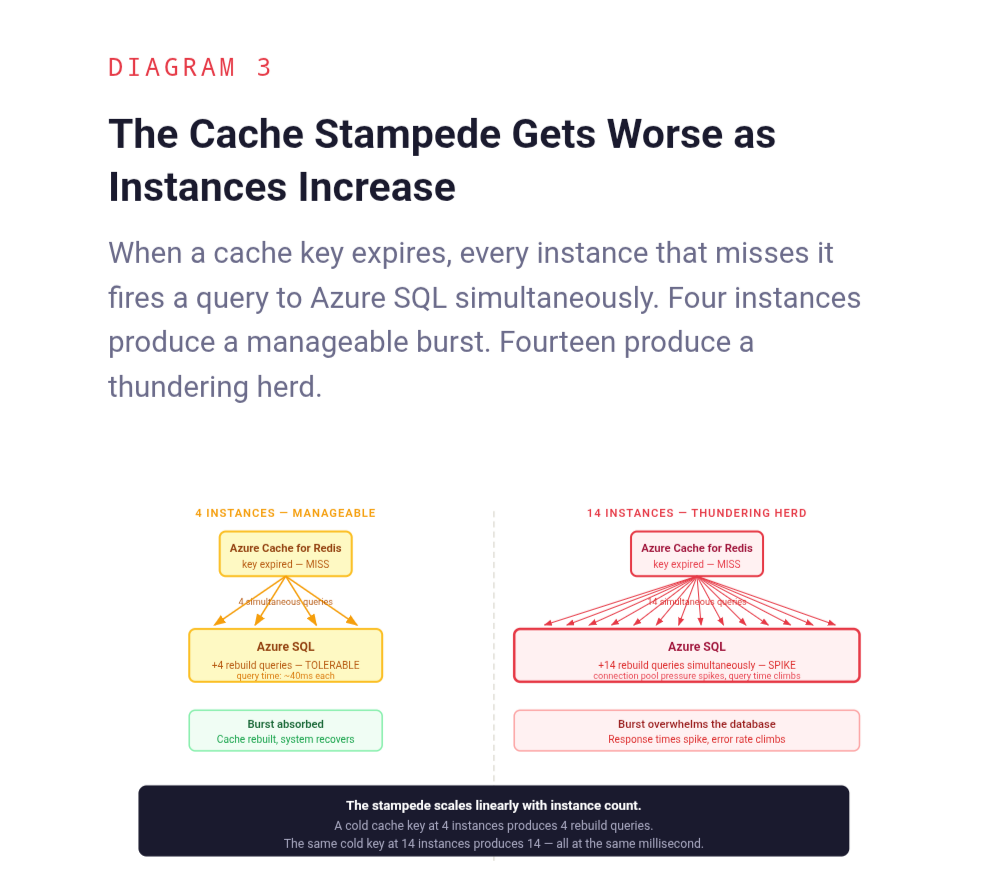
There is also a subtler version of this problem. When multiple instances simultaneously miss the same cache key and all attempt to rebuild it from Azure SQL, the database receives a burst of identical queries in the span of milliseconds. This is the cache stampede problem, a well-understood failure mode that becomes significantly more likely as the number of application instances increases. More instances means more concurrent readers of the same cold cache key, which means a larger and more damaging thundering herd when that key expires at the wrong moment.
Scaling the application without understanding how Azure Cache for Redis behaves under increased read pressure is how teams end up in situations where the cache, which was protecting the database, becomes the mechanism through which application scaling damages it.
Ask yourself: how does the cache hit rate change as the number of application instances increases? Has that relationship ever been measured, or is the cache assumed to scale transparently with the rest of the system?
What to Do Instead of Scaling Immediately
The instinct to scale when performance degrades is not wrong in principle. It is wrong when it is applied without first identifying what is actually constrained.
The question that should precede any scaling decision is simple: where is the system spending time? Not where are errors appearing, not which service is slow to respond, but where is time actually being consumed. The answer requires looking at the full request path, from the point the request enters the system to the point a response leaves it, and identifying where the cumulative latency is being generated.
In most systems, that investigation takes less time than a scaling event. Azure SQL Query Performance Insight reveals whether the database is doing expensive work that an index would eliminate. Connection pool metrics in Application Insights reveal whether application threads are waiting for connections rather than doing actual work. The end-to-end transaction view in Application Insights shows exactly which dependency is responsible for a disproportionate share of total latency. Azure Cache for Redis miss rates reveal whether the layer intended to absorb database load is actually doing so.
Each of these has a specific remedy. Slow queries get optimised or indexed. Connection pool saturation gets addressed through pool size adjustment that accounts for the actual number of instances, or through an Azure API Management layer that limits concurrent backend calls. Downstream bottlenecks get circuit breakers and fallback behaviours that prevent them from dragging the entire system down. Cache pressure gets addressed through Redis tier upgrade, eviction policy tuning, or stampede protection. These are the decisions that determine whether a system survives production pressure, not the number of App Service instances running the application code.
None of this means horizontal scaling is never the right answer. For systems where the application layer genuinely is the constraint, where CPU and memory in the App Service plan are saturated and the downstream dependencies have headroom, adding instances is exactly the right move. The problem is not scaling. The problem is scaling as a reflex rather than a conclusion.
Ask yourself: before the last scaling event in this system, was there a diagnosis of what was actually constrained, or was scaling the first response to a performance alert?
Back to the Tuesday Morning
The team on that Tuesday morning eventually found the Azure SQL database. It took forty minutes, two bridge calls, and a thorough tour of the wrong dashboards before someone opened Application Insights, switched to the dependency view, and saw the database response times climbing in lockstep with each new App Service instance that came online.
The fix was not glamorous. The App Service plan's maximum instance count was left in place, but the connection pool size per instance was reduced to account for the total number of instances that could be running simultaneously. A query that was executing a full table scan under concurrent load was indexed. The next traffic spike came three weeks later. Fourteen instances scaled up again. The Azure SQL DTU consumption stayed flat. Response times stayed at 180 milliseconds.
Same infrastructure decision. Different outcome. Because the second time, the decision addressed what was actually constrained.
The fourteen instances on that first Tuesday were not wasted. They were simply aimed at the wrong problem. The system had the capacity to handle the load. It was pointed at a layer that did not need it, while the layer that did need attention absorbed more pressure with every instance that came online.
Scaling is a tool. Like every tool, its value depends entirely on whether it is applied to the right problem.
More in The True Code of Production Systems
- Caching Is Easy. Production Caching Is Not.
- Silence Is a Design Decision
- CQRS Simplified the Design. It Complicated Production.
The True Code of Production Systems is a series about the decisions that only become visible when something breaks in production.
Read the full series at The True Code of Production Systems