
You Are Fixing the Wrong Thing
Performance problems do not start in production. They start in a codebase nobody was measuring. By the time the team is investigating, they are already three days into theories that have nothing to do with the actual answer.

The API had been slow for eleven days before anyone treated it seriously.
Not unusably slow. Not slow enough to trigger an alert. Just slow enough that a few users had mentioned it in support tickets, and a few engineers had noticed it during manual testing, and someone had added it to the backlog with a medium priority label and moved on.
When the team finally sat down to investigate, the conversation went the way these conversations usually go. Someone suggested the database queries might need optimisation. Someone else thought the payload was larger than it needed to be. A third engineer pointed to a dependency that had been redeployed two weeks ago and wondered whether something had changed. Everyone had a theory. Nobody had data.
They spent three hours across two days trying different fixes, deploying each one, watching response times, and finding that nothing moved meaningfully in the right direction.
On the third day, someone integrated an APM tool into the service.
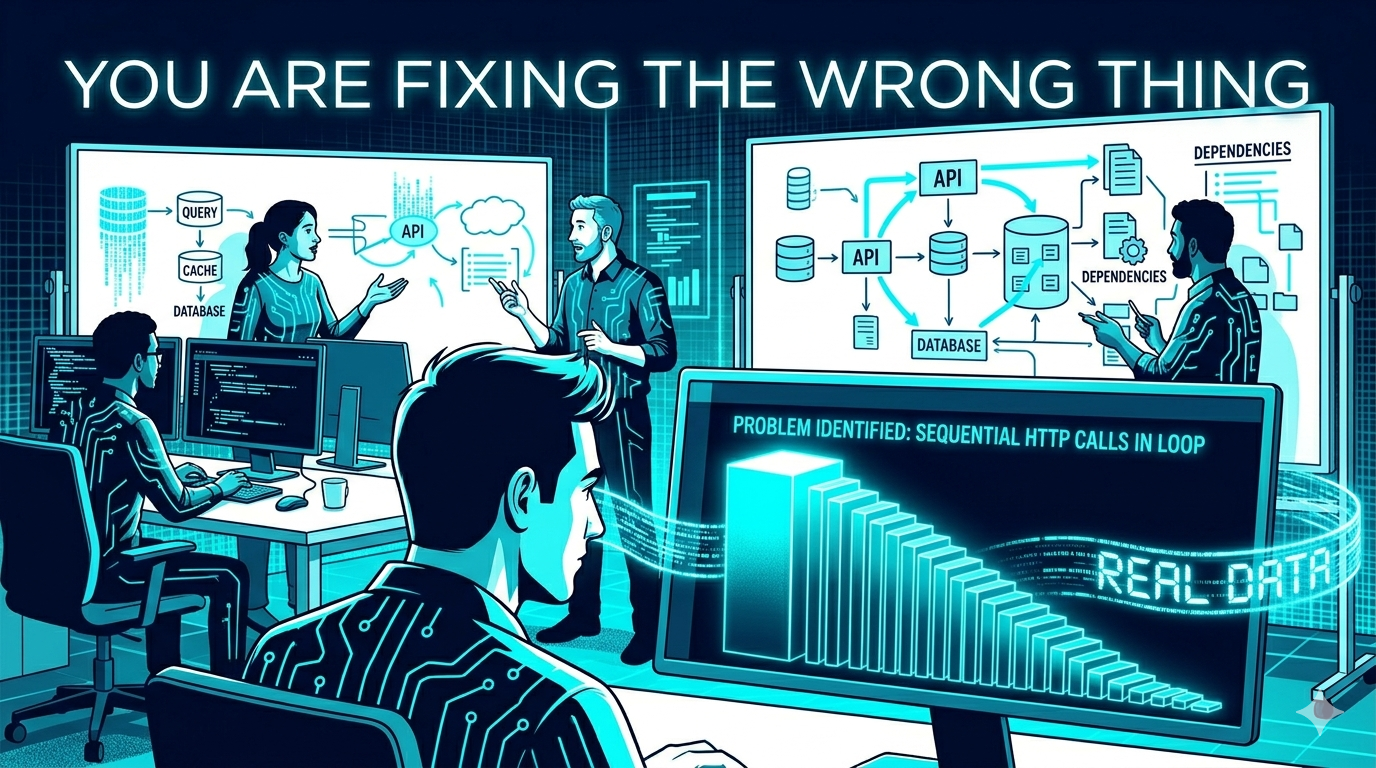
Within twenty minutes, they had the answer. A single method was making a downstream HTTP call inside a loop that ran once per item in a response collection. On average, the collection had forty items. The method was making forty sequential HTTP calls on every request, each one taking between fifteen and thirty milliseconds. The cumulative cost was sitting between 600 milliseconds and 1.2 seconds on every single response, quietly, on every request, for eleven days.
No query to optimise. No payload to compress. No deployment to roll back. One method, one loop, one pattern that had been in the codebase since the feature shipped.
The fix took an hour. The investigation, without APM, had taken three days.
What Gets Skipped When Performance Comes Up
Ask a team how they would improve a slow API, and the answers tend to follow a familiar sequence.
Optimise the database queries. Add a caching layer. Reduce the response payload. Minimise the number of downstream calls. Move expensive work to a background job. These are all legitimate techniques. They reflect genuine experience with performance problems that teams have solved before.
What almost never comes first is the question that should come first: where is the time actually going on this specific request, in this specific system, right now?
That question requires data. And in most teams, when a performance concern surfaces, that data is not readily available. There is no trace to look at. There is no breakdown of where each millisecond was spent. There is no history to compare against.
So the team reasons from experience and intuition. They pick the fix that seems most likely based on what has worked before. Sometimes they are right. More often, they are solving a problem that exists in theory while the actual problem continues undisturbed.
The three days in the example above were not wasted because the engineers were inexperienced. They were wasted because there was nothing to look at. The knowledge existed in the system. Nobody had a way to read it.
What APM Actually Captures in Production
Application Performance Monitoring instruments the running application and records what actually happens during request execution.
Not what the architecture diagram suggests should happen. Not what the code looks like in isolation on a developer's machine. What happens in production, on each request, under real traffic, with real data volumes and real concurrency.
A properly configured APM tool gives you a distributed trace for every request. Inside that trace, you see each method call that executed, how long it took, and what it called in turn. You see each database query, its execution time, and how many times it ran within a single request. You see each outbound HTTP call to a downstream service, the response time, and whether it happened sequentially or in parallel with other calls. You see where time accumulates and where it does not.
When a request takes two seconds to complete, APM tells you exactly where those two seconds went. That changes the nature of every performance conversation. Instead of generating theories, the team is reading a map.
In the example above, the map would have shown forty outbound HTTP calls in a single trace on the very first day. The three-day investigation would not have happened.
The Cost of Starting Without a Baseline
The three-day investigation is the visible cost. There is a less visible one that compounds quietly over time.
When APM is not present from the start, the team has no record of what normal looks like. They do not know what a healthy response time distribution looked like for this API six weeks ago. They do not know whether a deployment three weeks ago changed performance characteristics or whether the numbers were already moving before that deployment. They do not know which downstream dependencies have gradually degraded versus which ones have always been slow.
This matters because performance problems in production rarely appear suddenly. They tend to drift. A query that runs in eighty milliseconds under modest load takes two hundred under heavier load and four hundred under the load that arrives six months later when the user base has grown. A dependency that responds in thirty milliseconds during off-peak hours takes one hundred and twenty during peak windows. A payload that is a reasonable size today grows as features are added and nobody notices because each addition seems small on its own.
Without a baseline, none of this drift is visible until it has already become a problem. The team is always responding to the current state without knowing how it relates to any previous state. Every investigation starts from scratch.
APM integrated from the beginning of a service's production life builds that baseline automatically. By the time a performance concern surfaces, the team has weeks or months of historical data to compare against. They can see exactly when something changed. They can correlate a change in behavior with a specific deployment, a growth in data volume, or a shift in traffic patterns. The investigation does not start from scratch. It starts from a known point of departure.
That is the difference between an investigation that takes twenty minutes and one that takes three days.
Where Performance Problems Actually Live
The assumption underneath most performance conversations is that the bottleneck is somewhere obvious. A slow query. An uncached computation. A payload that could be smaller.
Production has a way of making that assumption expensive.
Performance problems in distributed systems have a consistent property: they surface in one place and originate in another. The API is slow, but the API is slow because it is waiting. It is waiting for a database that is handling more concurrent connections than it was provisioned for. It is waiting for a downstream service that is itself under pressure. It is waiting for a cache that is evicting keys under memory load and pushing more traffic to the database behind it. It is making forty sequential HTTP calls when the code was written to handle a collection of three items, not forty.
The symptom is the slow API. The cause is somewhere in the dependency chain below it.
Without APM, the team investigates the API. They look at the code. They add indexes to queries that are not the bottleneck. They compress payloads that are not the problem. They redeploy with changes that do not move the number. Meanwhile, the actual cause continues unchanged in the layer they were never looking at.
APM makes the full request path visible. Not just the application layer, but every hop the request makes through the system, and how long each hop took. The cause does not hide when the entire path is instrumented.
Ask yourself: for the last performance incident in this system, how long did it take to identify where the time was actually going? Was that time spent investigating the right layer, or were there detours into layers that turned out not to be the problem?
The Environments Where Problems Are Born
There is a version of this that happens even before production, and it is worth understanding separately.
A performance problem in production did not become a problem in production. It was a problem before that. It was a problem in the performance environment. It was a problem in staging. It existed in those environments the same way it existed in production. The difference is that nobody was measuring in those environments, so nobody saw it.
The API making forty sequential HTTP calls was making forty sequential HTTP calls in the performance environment, against test data, with a response collection that happened to have forty items. If APM had been running there, the trace would have shown forty outbound calls on every test request. Someone would have seen it before it reached production.
Most teams treat APM as a production concern. The reasoning is understandable. Production is where real users are. Production is where incidents happen. Production is where the pressure is.
But the behaviors that cause production incidents exist in lower environments first. API response times in staging reflect the same code that will run in production. Memory profiles in the performance environment are the same application under controlled load. A query that runs in 800 milliseconds in staging will not become fast in production. It will become slower as data volumes grow and concurrent load increases.
Integrating APM in lower environments means the same signals are available throughout the delivery cycle. A performance characteristic that degrades between one deployment and the next is visible in staging before it ships. The cost of catching it there is a code review and a fix. The cost of catching it in a production incident is three days of investigation, user-facing degradation, and a post-mortem.
Ask yourself: if an API response time degraded by 400 milliseconds between last week's deployment and this week's, would that change be visible in your staging or performance environment? Or would it only surface once it reached production?
The Specific Signals That Matter
APM is not useful in the abstract. It is useful because of the specific signals it surfaces, and it is worth being precise about what those are.
Response time distribution at the method level is the first one. Not just the overall API response time, but how that time is distributed across the methods that execute within a request. A method that takes 600 milliseconds on every request is obvious when you can see it. It is invisible when the only number available is the total request duration.
Database query performance is the second. Not whether queries are running, but how long each individual query takes, how many times it executes within a single request, and whether that number changes under different data conditions. A query that runs once in normal circumstances and forty times under certain data shapes is a problem that only becomes visible when the execution count is tracked per request.
Downstream service response times are the third. Each outbound HTTP call to a dependency should appear as a distinct span in the trace with its own timing. A dependency that is adding 300 milliseconds to every request that touches it is a known quantity when the trace shows it. Without the trace, it is a theory among other theories.
These three signals, consistently available, answer the question that every performance conversation should start with: where is the time going?
Ask yourself: right now, without any investigation, can you identify which method in your slowest API is consuming the most time? If that answer is not immediately available, what would it take to make it available?
What Changes When APM Is There From the Start
The performance conversation described at the beginning of this article does not have to play out the way it did.
With APM integrated from the first production deployment, the eleven days of slow response times would have had a different character. Not because the problem would not have existed, but because the investigation would not have been speculative.
Someone raises the concern. The API is slow. Before anyone proposes a fix, someone pulls up the traces for the slowest requests from the past hour. The distribution is visible. The method consuming the most time is visible. The forty sequential downstream calls are visible. The conversation skips directly to what to do about a known problem rather than generating theories about an unknown one.
The fix still takes an hour. The three days do not happen.
This is what APM changes in practice. Not the nature of the problems that arise in production, but the cost of understanding them when they do. Performance problems in production are not prevented by APM. They are diagnosed before the theories run out.
That is a different kind of value than most infrastructure decisions produce. And it is available from the first day the service runs under real traffic, if the integration happens early enough.
Ask yourself: when a performance concern surfaces in your team, what is the first thing someone looks at? If it is not a trace or a method-level breakdown, what is the cost of the gap between that first look and the eventual answer?
Before the Next Deployment
There is a practical checklist worth running through before any service goes to production without APM integrated.
Does the team have visibility into method-level response times, or only total API duration? Does the team have visibility into how many times each database query executes per request, or only that the database is being called? Does the team have visibility into downstream service response times as distinct spans, or only that calls are being made? Is there a baseline of what normal looks like that can be compared against after the next deployment?
If any of these answers is uncertain, the service is running in production with less visibility than the next performance incident will require.
APM is not a debugging tool to reach for when something breaks. It is the instrumentation that makes the difference between understanding a production system and guessing at one. The time to integrate it is before the service handles real traffic, not after the first incident makes its absence conspicuous.
The eleven days in the example above were not inevitable. The investigation that followed was not inevitable. Both were the result of a service running in production without the foundation that would have made them unnecessary.
The True Code of Production Systems is a series about the decisions that only become visible when something breaks in production. Read the full series at The True Code of Production Systems