
Why Most ASP.NET Core Apps on IIS Run Without Real Monitoring
Most ASP.NET Core apps on IIS have no real monitoring. Not because teams don't care, but because traditional APM tool is priced for large server setups or sends data to an external server. RuntimeIQ fixes this with two lines of code, no per-host fee, no data leaving your server.

It is 9:40 in the morning, and a support ticket just landed. A user says checkout took almost a minute to load yesterday evening. Nobody on the team saw it happen, because nobody was watching. There is no chart to check. No alert that fired. No record of what the application was doing at that hour, beyond whatever IIS happened to log on its own.
Someone opens the logs and starts scrolling. Hoping the right request is still in there. Hoping the timestamp lines up. Hoping this turns into an answer instead of a guess.
For a large share of production ASP.NET Core applications, this is not a bad day. It is the entire monitoring strategy. Not a dashboard. A support ticket, read after the fact, about something that already happened and cannot be reproduced on demand.
Here is the thing that changes this: two lines of code, and a dashboard running inside the application itself.
The package is called RuntimeIQ. I built it after seeing this pattern repeat across different teams and different applications for longer than I want to admit. Not because anyone was careless. Because every tool built to prevent this was built for a different shape of application than the one actually running in production. RuntimeIQ is a NuGet package for ASP.NET Core web applications and Web APIs on .NET 6 and later, hosted on IIS, that gives you a live diagnostics dashboard with no agent, no separate server, and no data leaving the machine it runs on.
RuntimeIQ.Core is on NuGet now, two lines of code to install. The live demo, full feature list, and configuration reference are at runtimeiq.dev.
The rest of this article covers two things: why teams end up without this kind of visibility in the first place, and exactly what RuntimeIQ's dashboard shows once it is installed.
Three Reasons This Keeps Happening, Not One
Reason one: the pricing model was built for a fleet, not for you
Enterprise APM tools, Datadog, New Relic, Dynatrace, are priced around an assumption. Many hosts. Many instances. A meaningful volume of data flowing in every single hour. Per host, per agent, per gigabyte ingested, with tiers built for teams running dozens or hundreds of servers.
A single ASP.NET Core application hosted on IIS, quietly running one internal workflow or serving one steady client base for years, simply does not match that shape. The tool is not too advanced for the job. It is priced for a different sized problem entirely. A team running two or three applications like this cannot reasonably justify the bill for the amount of visibility a single response-time chart would actually give them.
So the conversation about buying one of these tools ends at the pricing page, before it even starts. RuntimeIQ has no per-host fee to begin with, because it never leaves the host. There is no pricing page conversation to end, because there is no fleet-sized bill to weigh against a single application.
Reason two: lower environments lose the budget argument, every single time
Even a team that does stretch the budget far enough to license an APM tool for production usually stops right there, because licensing is almost always charged per instance or per host. Extending that same license to staging, UAT, and QA does not add a small cost on top. It can double or triple the bill, for environments that generate no revenue and are difficult to defend in any budget review.
The result is a pattern worth sitting with, because it is almost the opposite of what you would design on purpose:
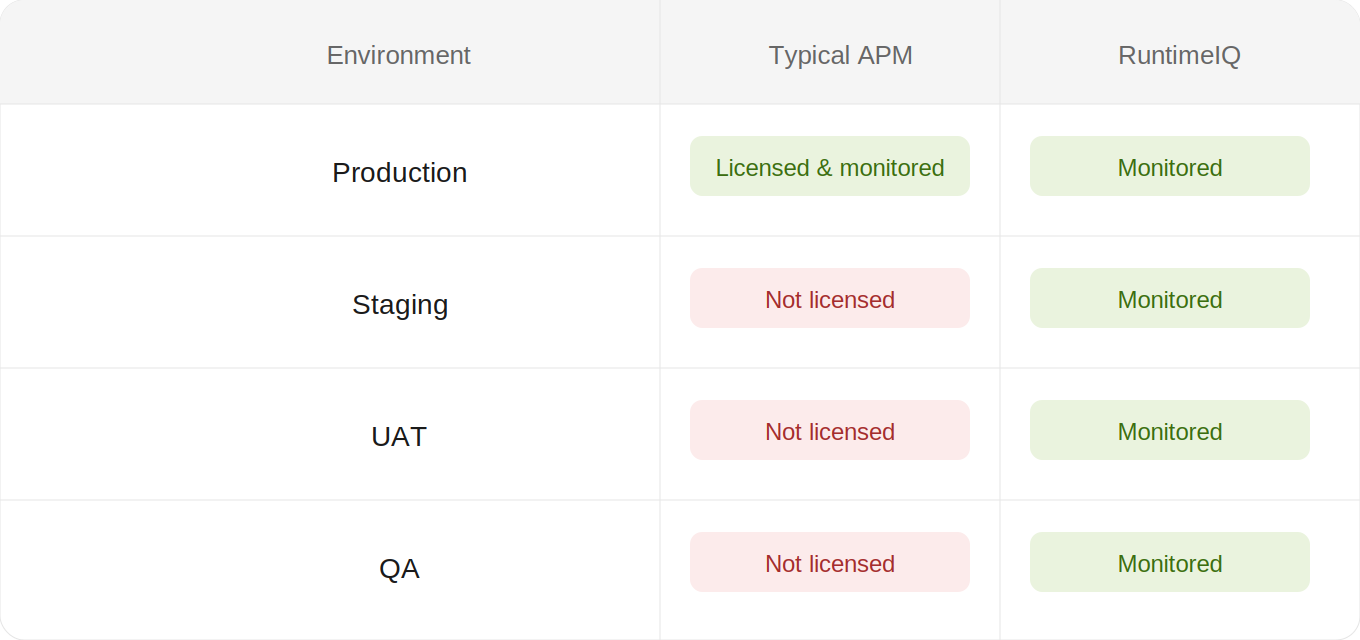
The one environment with real visibility, under the old model, is the one where a problem found has already shipped. Under RuntimeIQ, every environment gets the identical dashboard, because there is no per-instance fee deciding which environments are worth the money.
Reason three: some environments cannot send data outward, no matter the budget
For applications in finance, healthcare, government, or any setting with strict data residency rules, there is a constraint that has nothing to do with money at all. Telemetry, request payloads, query text, full stack traces, often cannot leave the organization's own infrastructure under any circumstances. A SaaS-based APM tool that ships this data to an external vendor's cloud does not get turned down for being too expensive. It gets turned down before the pricing conversation even starts, because compliance will not approve it, full stop.
Teams in this position are not choosing to skip observability. They are choosing between a tool they are not allowed to use, and no tool at all. RuntimeIQ was built so that question never has to be asked. Everything it captures is written to a SQLite database embedded inside the library, sitting on the same server as the application itself. Nothing is shipped outward, to anyone, ever. There is no vendor cloud to approve, because there is no vendor cloud involved.
Put these three reasons side by side and a clear pattern emerges. Every available option either costs more than the problem justifies, cannot be licensed across the environments that actually need it, or cannot legally leave the building.
What RuntimeIQ Is Actually Watching Right Now
This is not a feature list. This is what the dashboard shows, with real data, the moment it is installed.
Exceptions, deduplicated by type and message
Open RuntimeIQ's Exceptions screen, and a flood of identical errors stops looking like a flood:
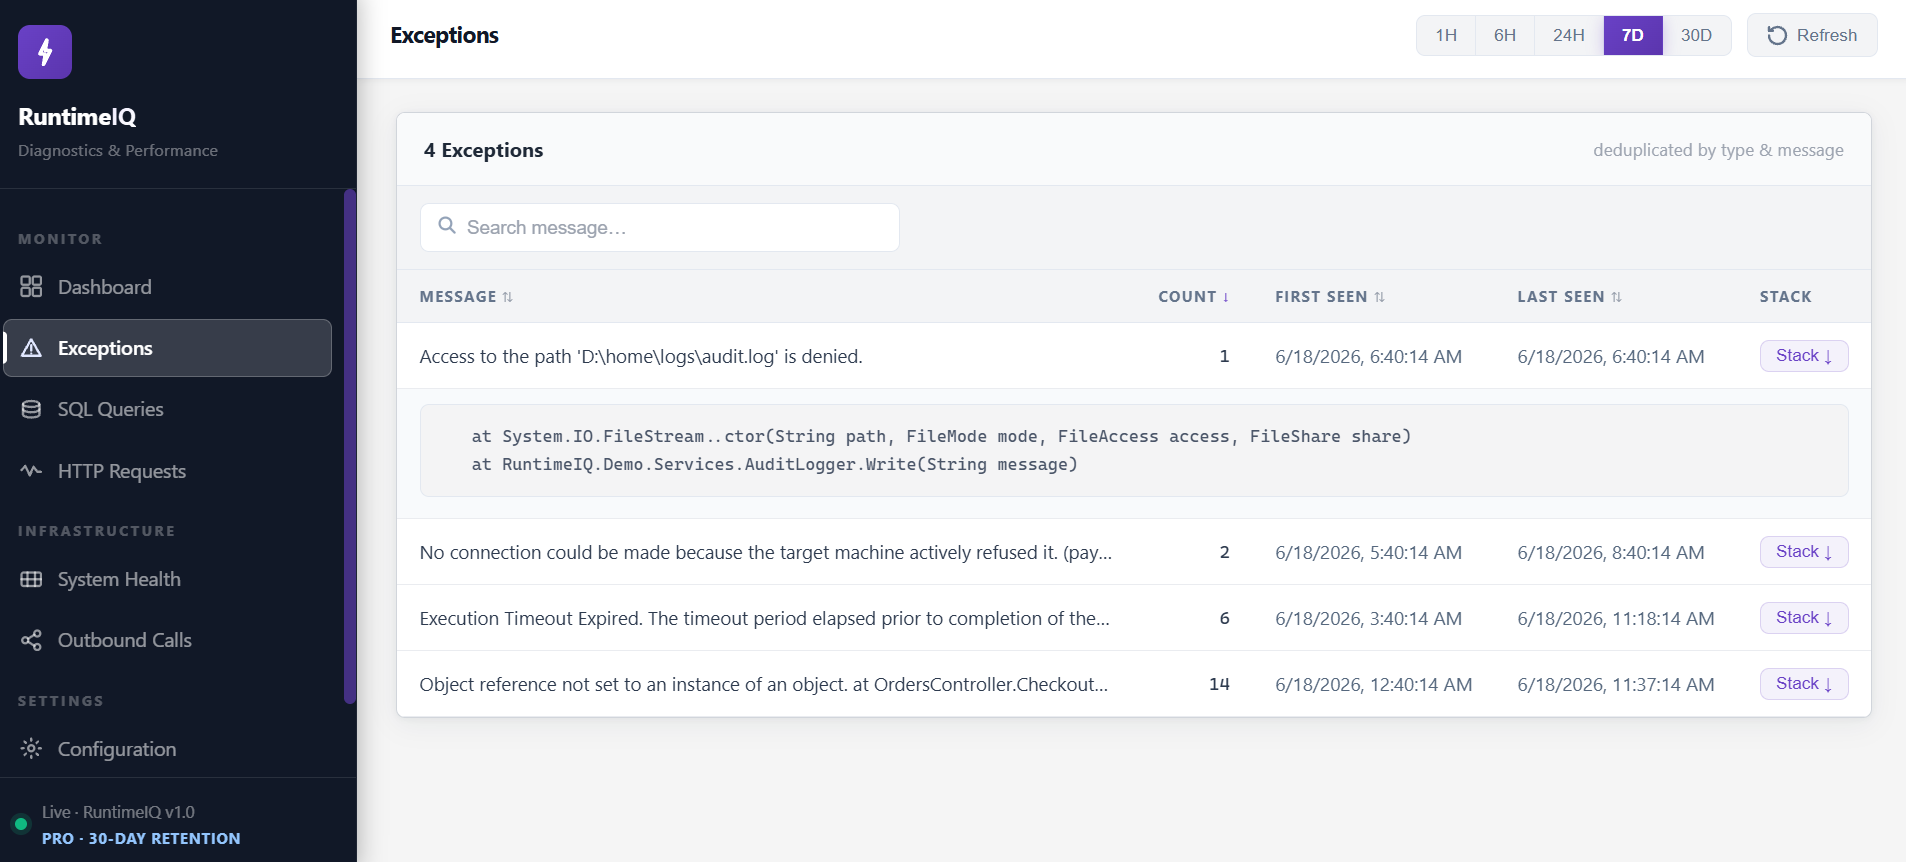
Fourteen occurrences of one real problem become one row, with a number that tells you exactly how urgent it is, deduplicated automatically, with the full stack trace one click away. Nobody manually sorted this. RuntimeIQ did, the moment the exception fired.
Slow SQL queries, captured without touching your data access code
Most ASP.NET Core line-of-business apps are CRUD-heavy and built around SQL Server, and most of their real performance problems live in the database layer, not the application code. RuntimeIQ's SQL Queries screen looks like this:
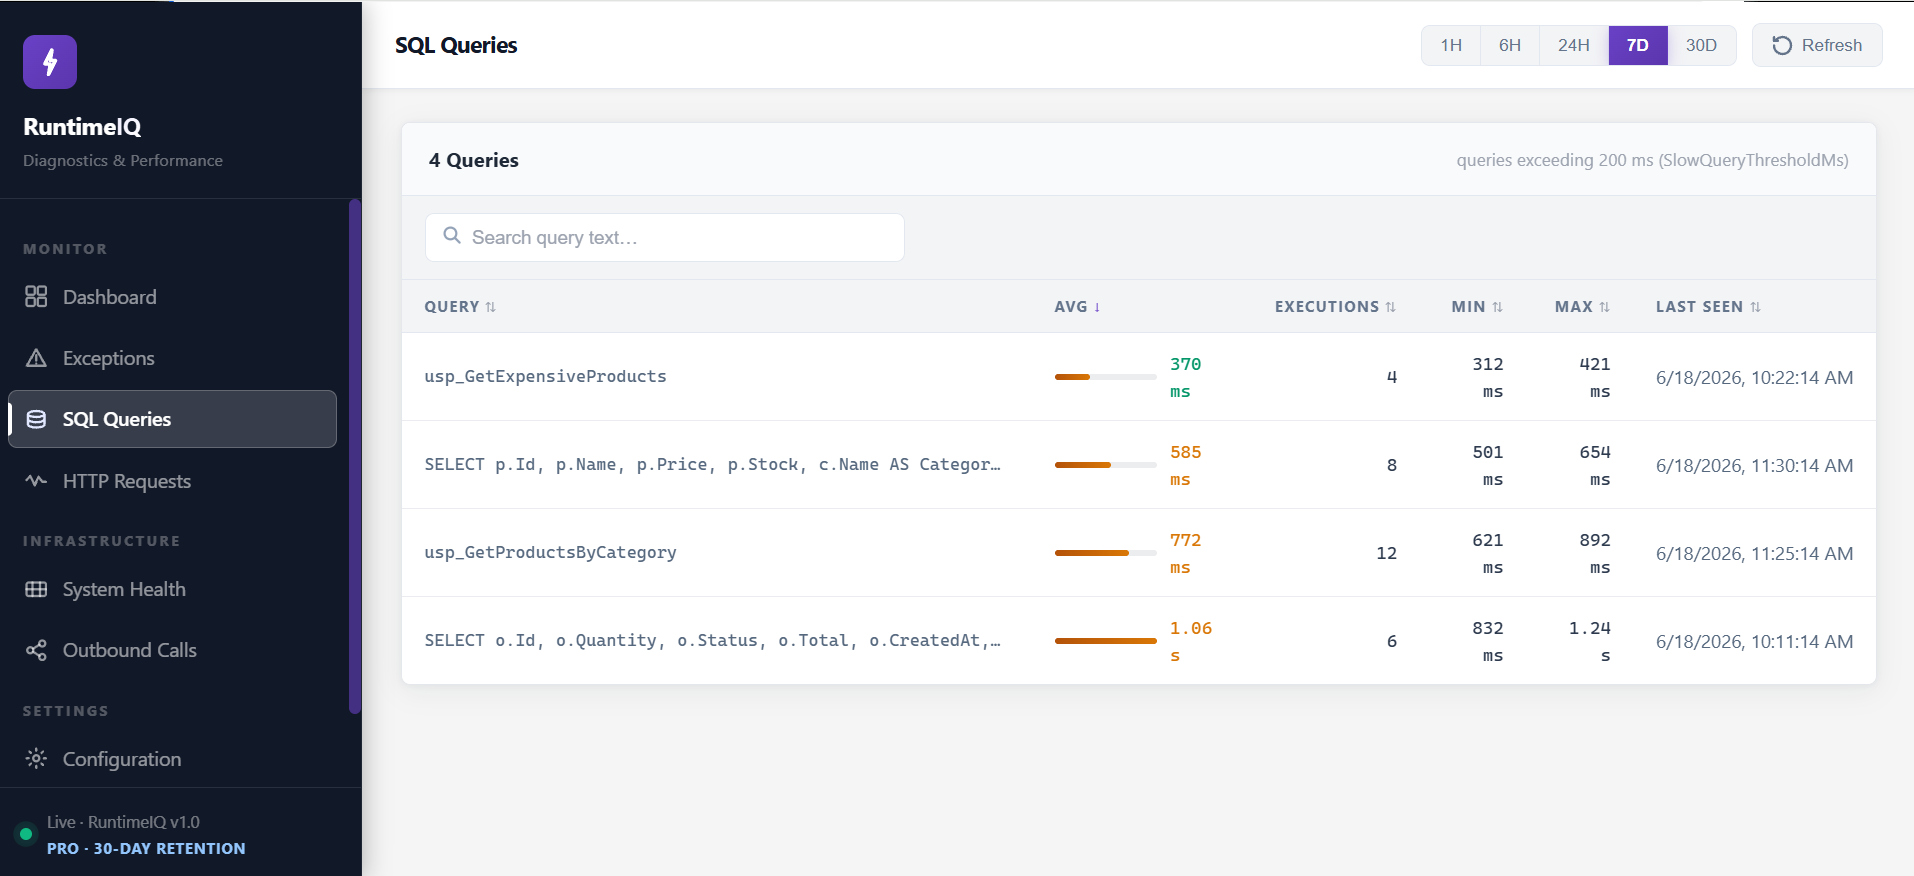
It works whether the query came through ADO.NET, Dapper, EF Core, or a stored procedure, and it works against SQL Server or any EF Core-supported database, PostgreSQL, MySQL, SQLite, without a single line of data access code being touched. A query creeping from 370 milliseconds toward a full second shows up as a trend here, weeks before it ever becomes the thing a customer complains about.
HTTP response time, per endpoint, in every environment, not just production
RuntimeIQ's HTTP Requests screen, the same view, identical, in staging as in production:
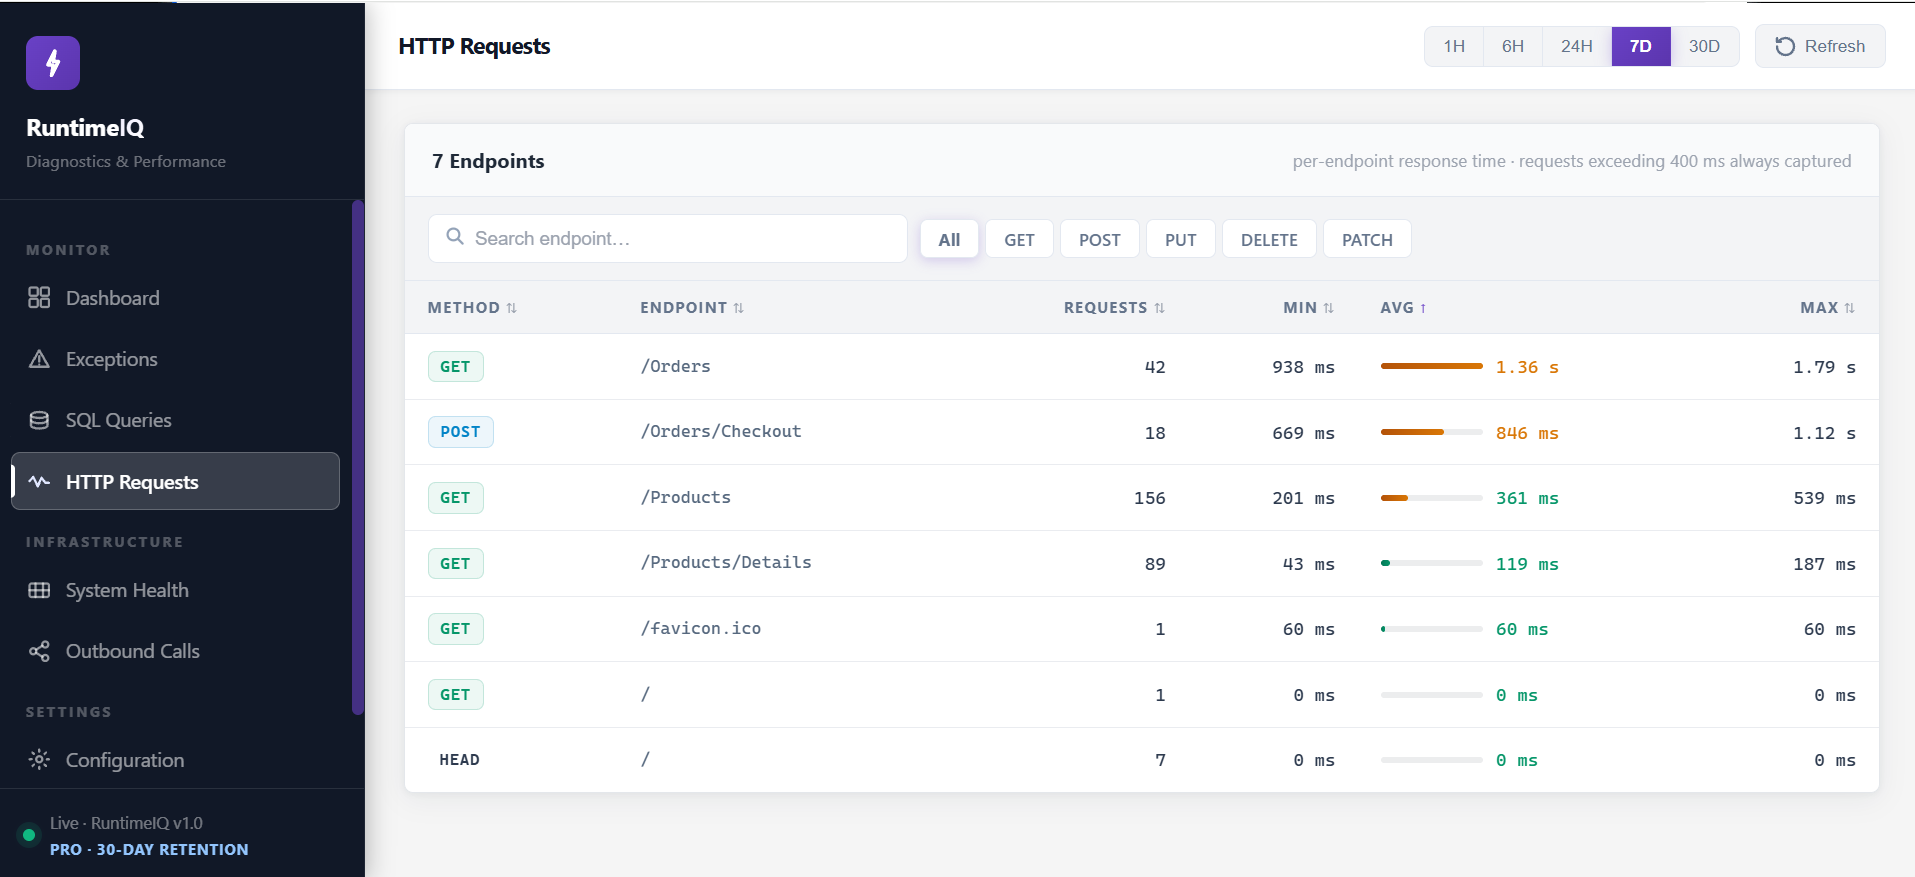
Because there is no per-environment cost, there is no reason this table only exists where the budget allowed it. The regression that used to be found by a customer in production gets found by the team, in staging, days earlier.
Outbound HTTP calls, including failures, with zero code changes
This is the screen most lightweight tools skip entirely, and frequently the one that matters most, because the calls an application makes outward are usually invisible until something customer-facing breaks. RuntimeIQ's Outbound Calls screen:
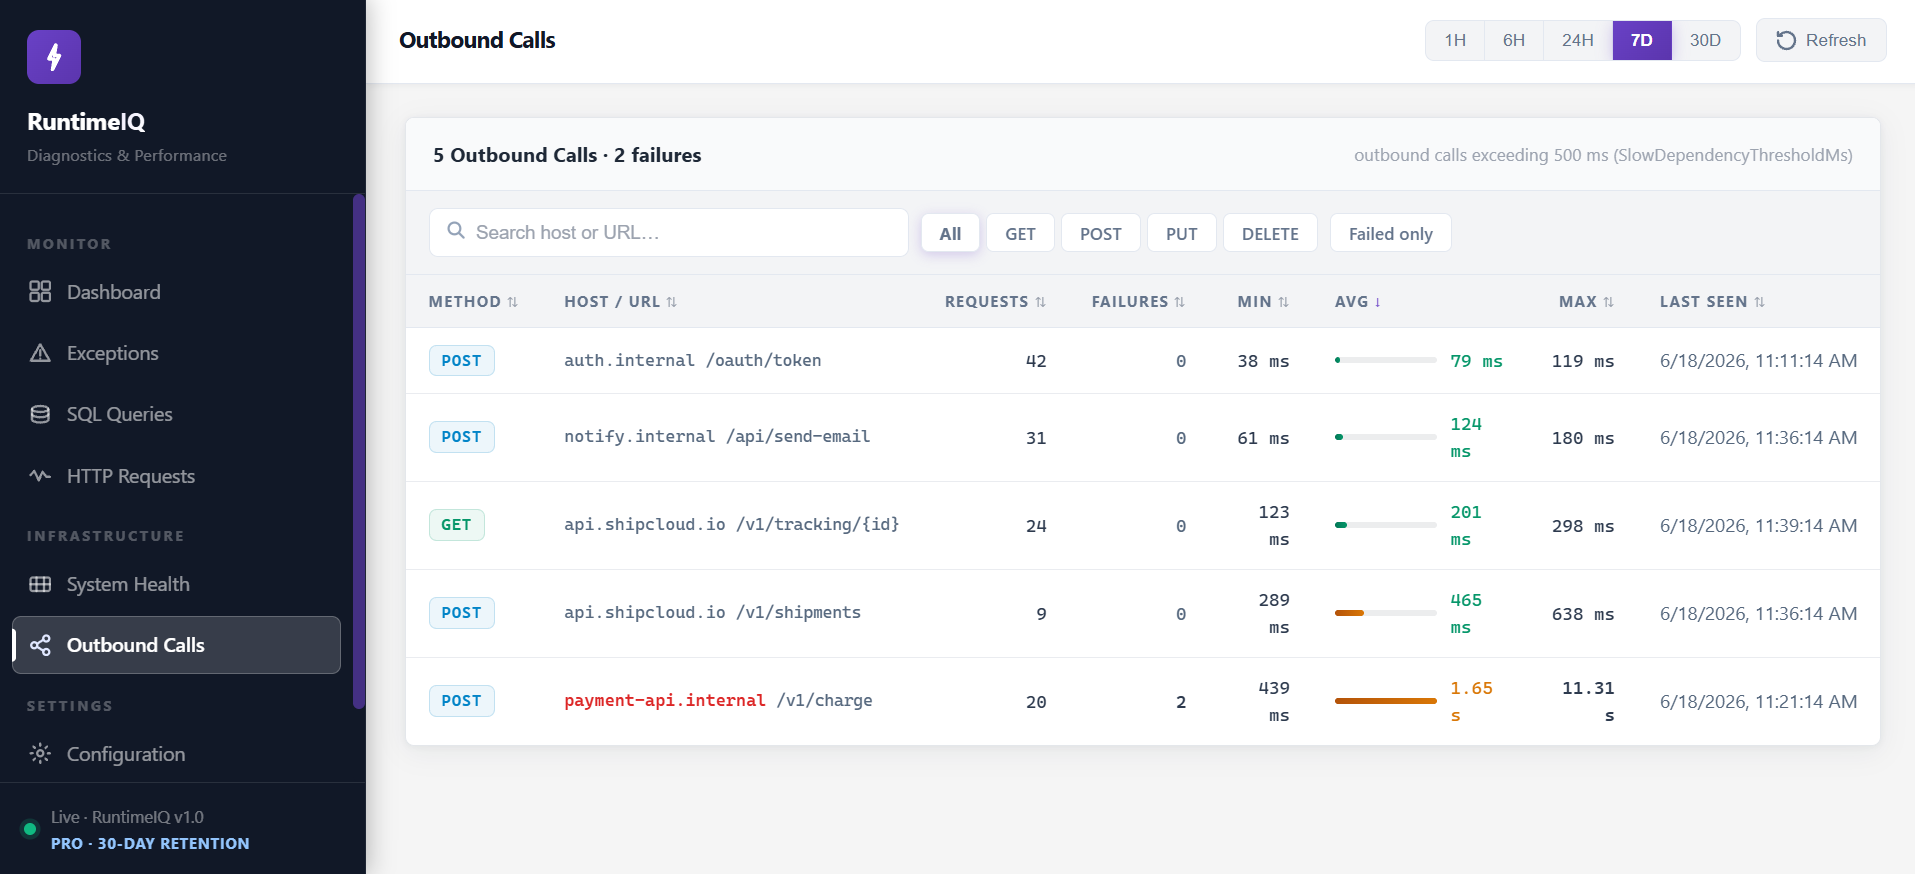
Two failed payment calls and a 1.65 second average, sitting in this table, is very often the actual incident. Not in the application's own code at all. In a dependency nobody was watching, because RuntimeIQ tracks every HttpClient call by default, without any code change.
CPU and memory, app-level and server-level, snapshotted every 15 seconds
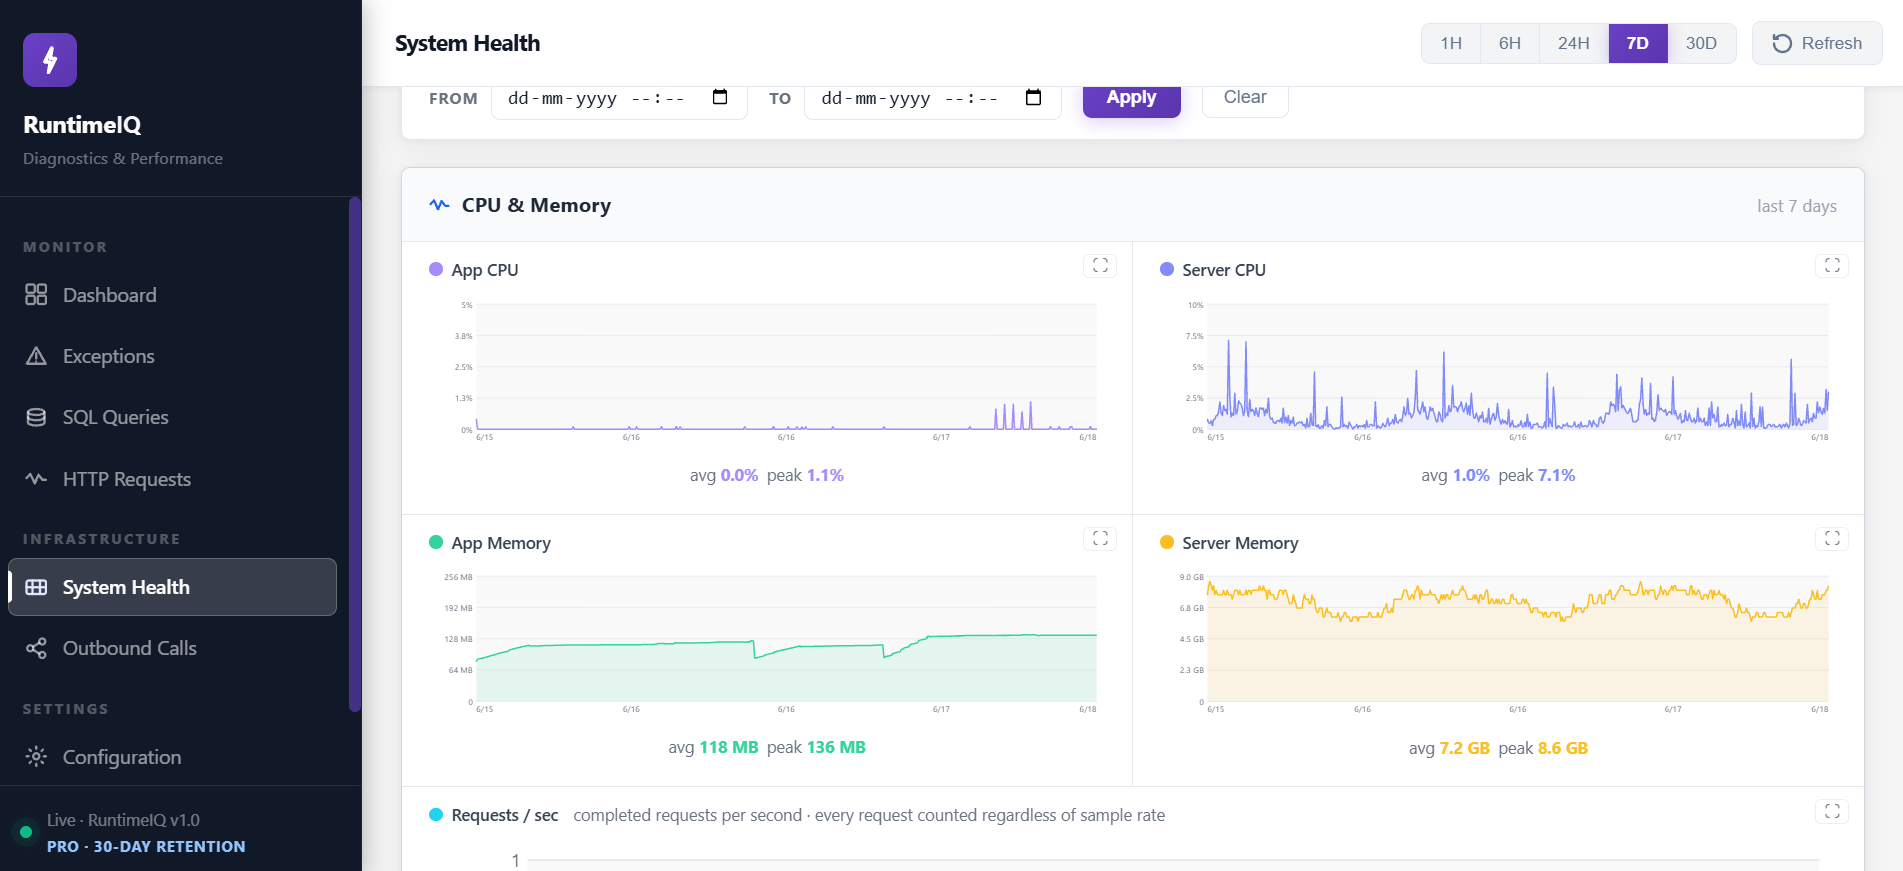
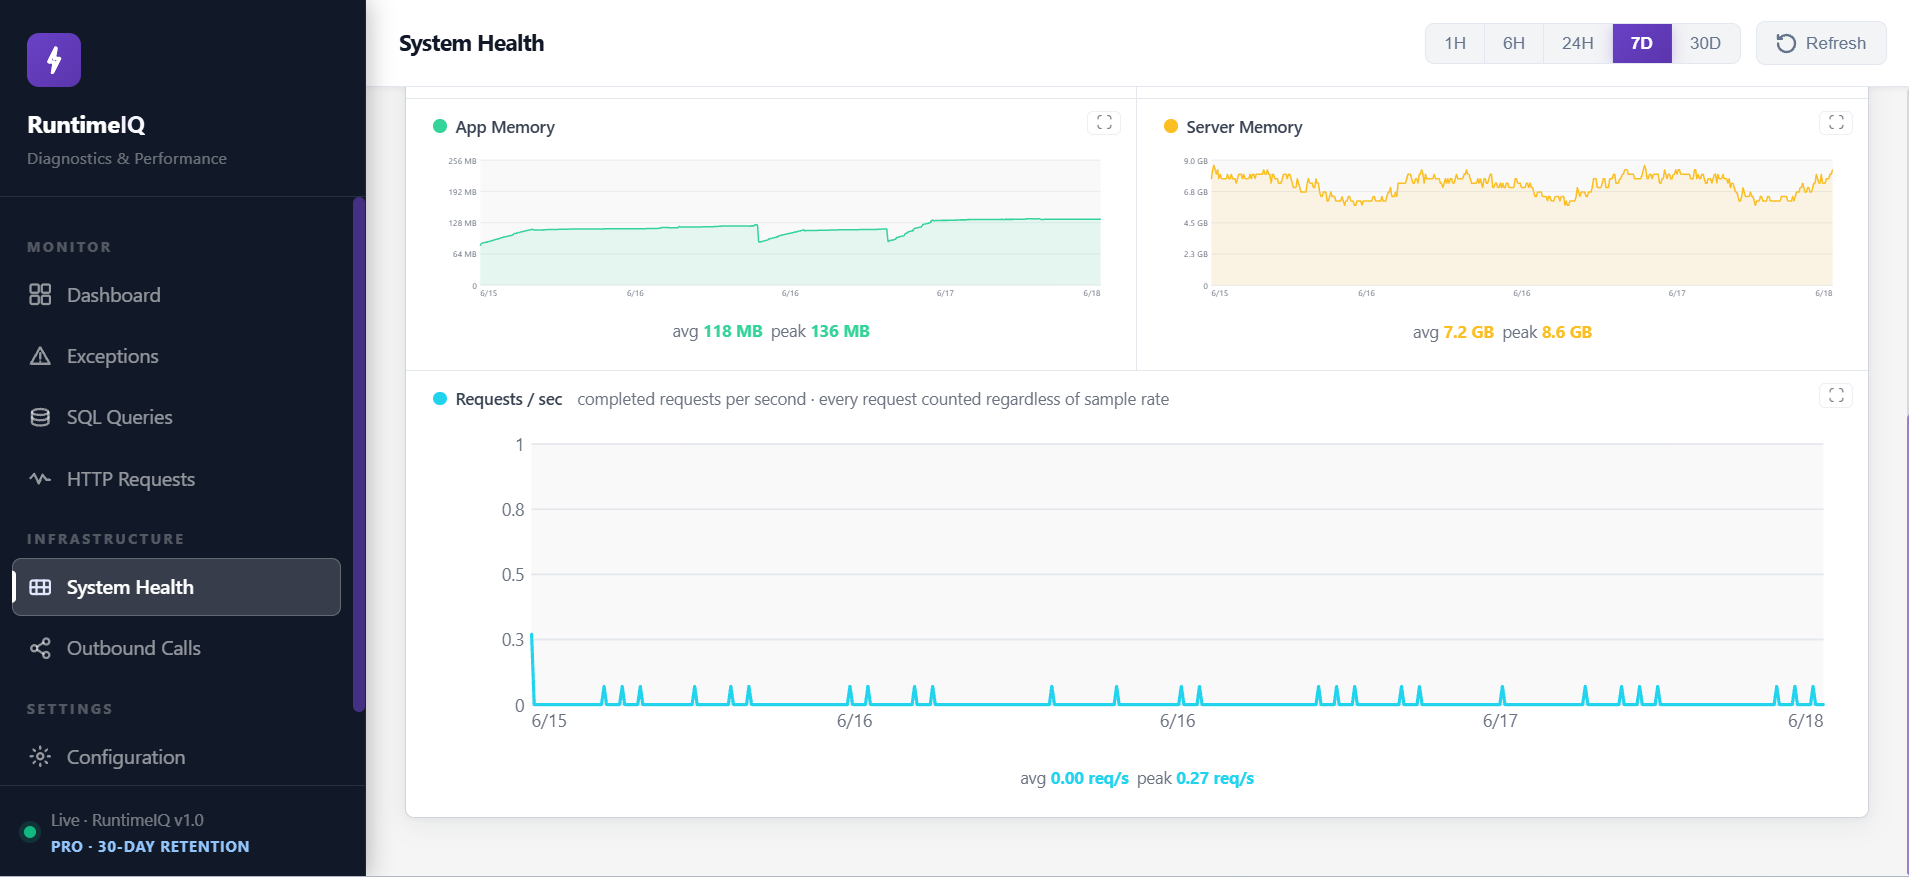
In a fixed-instance deployment, with no autoscaler making decisions automatically, capacity planning is a judgment call made by a person. RuntimeIQ's System Health screen turns that judgment into a real trend across days and weeks, instead of a guess based on how things felt last month.
Configuration, visible exactly as it is actually running
RuntimeIQ's Configuration screen, read directly from the running application:
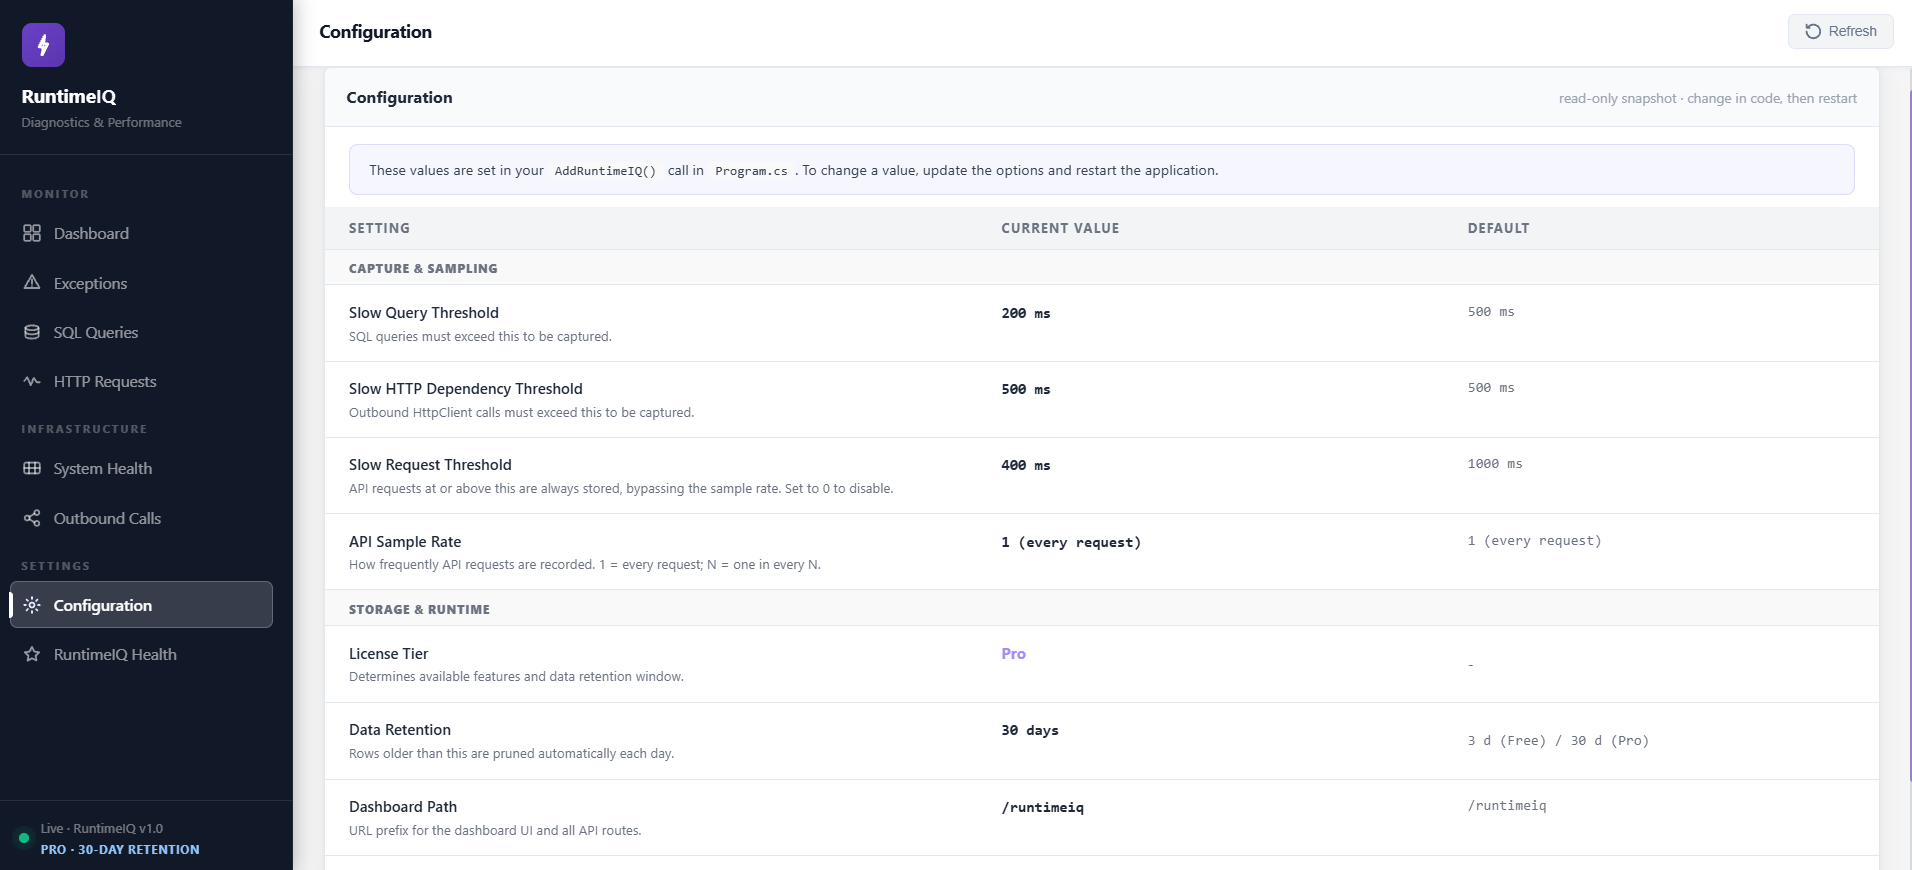
When an audit or an incident review asks what threshold was live at the time, the answer is on this screen, taken from the running application itself, not from a config file in source control that may or may not match what was actually deployed.
Six screens. One package. All of it running before lunch, if the two lines below are already in your Program.cs.
See it for yourself at runtimeiq.dev. Live demo, configuration reference, and plans, no install required to look around.
The Honest Questions Before You Install Anything
A new package with closed source, asking for a place inside a production application, deserves real scrutiny before anyone adds it. Here is that scrutiny, asked plainly.
Why is the source closed, and should that bother you? The dashboard, the capture logic, the SQLite layer, all of it is the product. Keeping it closed is a normal choice for a tool built this way, not a red flag specific to this one. What you can verify instead: it writes to a local SQLite file you can inspect yourself, it makes no outbound network calls beyond the ones your own application already makes, and the dashboard route is one you control and can lock down with a username and password.
What happens if it breaks something? Every write is fire-and-forget. The request thread serving your user is never blocked by a diagnostic write happening behind it, so the tool that exists to tell you the truth about performance cannot itself become the thing slowing a request down.
What if you outgrow it? If the application moves to autoscaled App Service or to containers in Kubernetes, this version is not built for that shape, and it will not pretend otherwise. That is a genuinely different architecture problem, ephemeral instances, aggregating across a fleet, and stretching one tool to claim both would be the kind of overselling this article has tried to avoid throughout.
That is the honest list. What is left is two lines of code.
In Program.cs, register the service:
builder.Services.AddRuntimeIQ();
And in the middleware pipeline, enable it:
app.UseRuntimeIQ();
That is the entire setup. No agent to deploy separately. No central collector to provision. No external dashboard to stand up, secure, and maintain on top of everything else the team already owns. The moment the application restarts, the dashboard above is live, served at /runtimeiq by default, inside the app, on your server, under your control.
What This Means in Practice
That gap, cost that does not scale down, environments that never made the budget, telemetry that cannot leave the building, was never about priorities. It was every available option being built for a different shape of problem.
RuntimeIQ was built for that team specifically, the one in the 9:40 AM scenario above, not as an example, as the actual target user: a team running an ASP.NET Core web application or Web API, on .NET 6 or later, hosted on IIS, whether on-premises or on a cloud VM.
RuntimeIQ.Core is on NuGet now. Two lines of code, and the full picture, demo, configuration, and plans, is at runtimeiq.dev.